

Most people think electricity has two states - on or off. But the Indian grid is far more talkative than that. Long before a blackout hits, the grid starts sending signals: voltage sags, repeated dips, transformer strain, and evening instability. The problem has always been that almost nobody had the instrumentation to hear them.
When TEC began deploying FlexiPOD with FlexiTwin energy storage systems, the original mission was clear: provide reliable backup power, improve battery performance, and optimize energy behaviour for homes and institutions across India.
Over multiple deployments, similar voltage degradation patterns were repeatedly observed across geographically separate sites. Across multiple deployments, the same patterns kept repeating - patterns that had nothing to do with the energy system itself. The telemetry indicated persistent characteristics of local distribution network behaviour.
" Across sites, voltage remained relatively stable during low-demand periods but deteriorated consistently during evening peak-load intervals between approximately 18:00 and 21:00. Sudden dips during cooling load spikes. Recurring low-voltage windows at almost the same time every day - sometimes affecting just one apartment cluster, sometimes one street."
The ESS infrastructure effectively functioned as a distributed monitoring layer capable of observing neighbourhood-level voltage behaviour at high temporal resolution.
Voltage observations collected between April 4 and May 11, 2026, show a progressive increase in low-voltage events during evening demand periods. For the first two weeks of April, grid voltage at this site held steadily between 240V and 255V. Then, from around April 19 onward, voltage stability deteriorated - dips became deeper, and low-voltage events below 210V began appearing with increasing regularity, particularly after 6 PM when households return home and ramp up cooling loads.
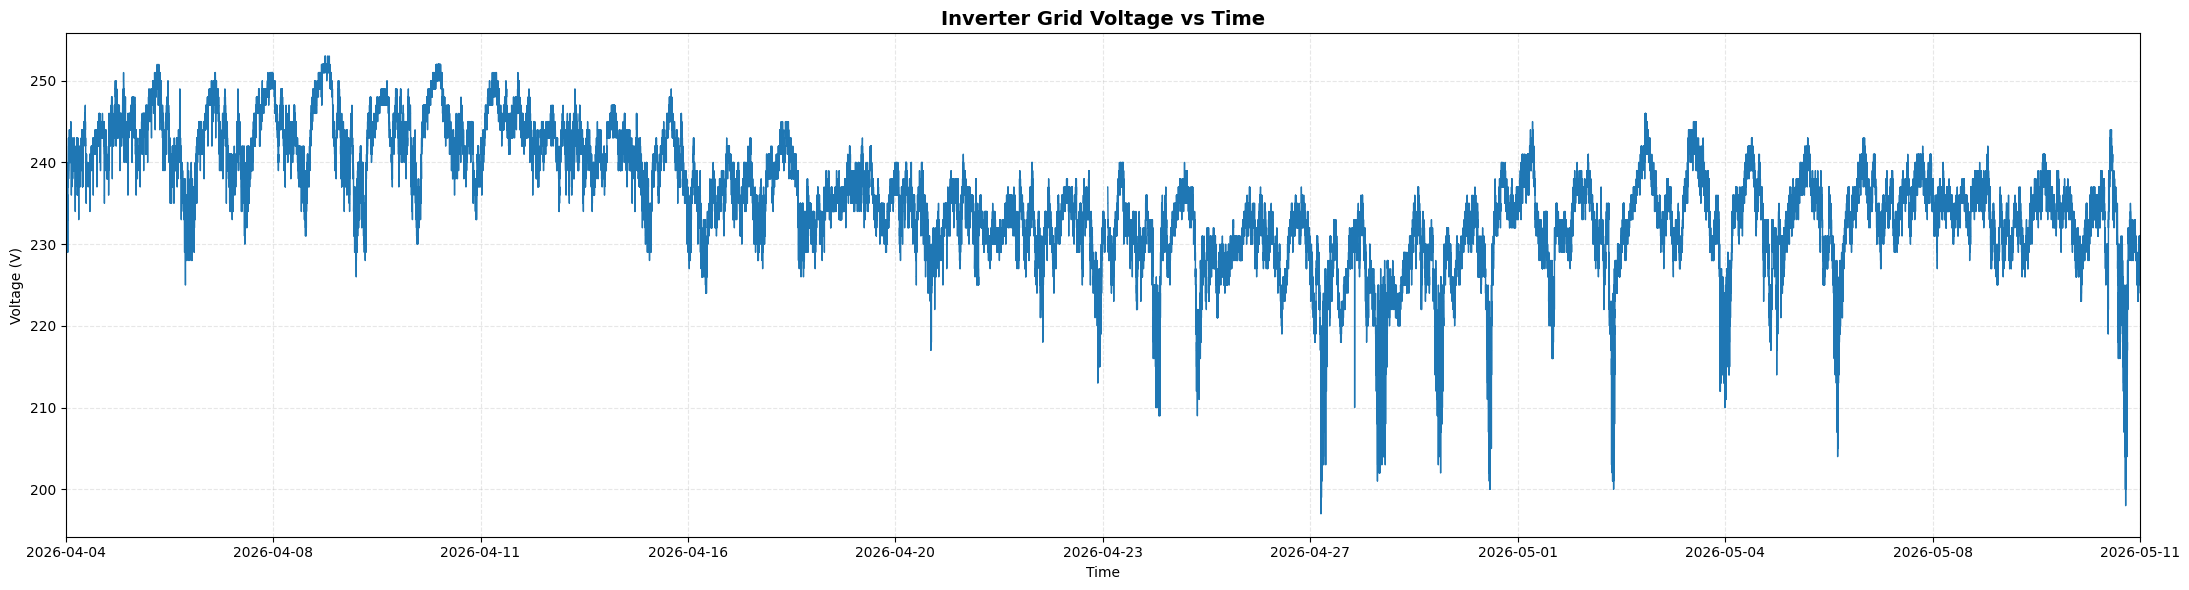
The observed behaviour is consistent with feeder-level loading stress during peak residential demand intervals. Conventional consumer metering systems typically do not capture voltage behaviour at this temporal resolution.
The real-time monitoring view below captured a 90-minute window on April 30, 2026 - a completely ordinary evening at a live deployment site. Grid voltage swung between approximately 200V and 230V within that single window - right in the 6–9 PM window when demand surges across the neighborhood.
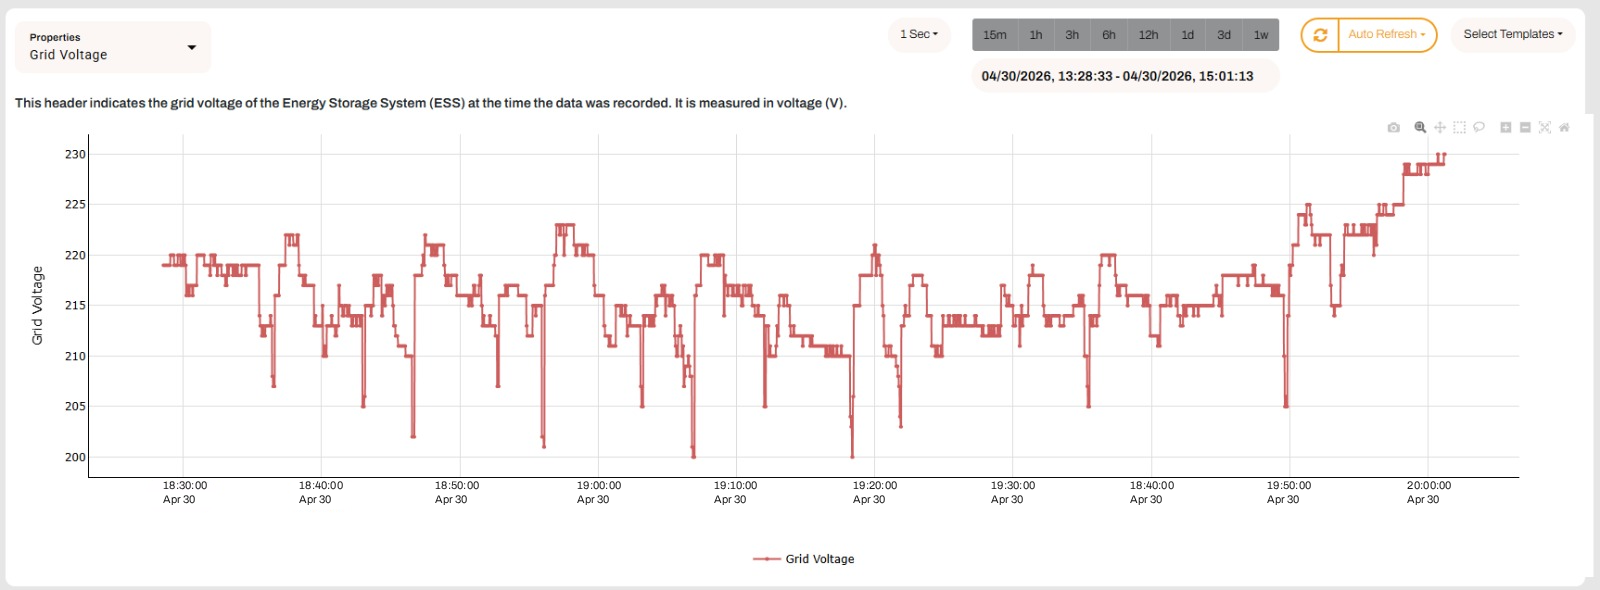
This is the hidden nature of voltage sag: appliances still function, but they're operating under stress conditions that reduce operating efficiency, shorten compressor life, and increase failure rates across everything connected to the same transformer pocket.
One of the most significant findings from FlexiPOD field data is the direct, measurable relationship between local AC output demand and grid voltage. The scatter plot below draws on thousands of real measurements from a single deployment. The pattern is unambiguous.
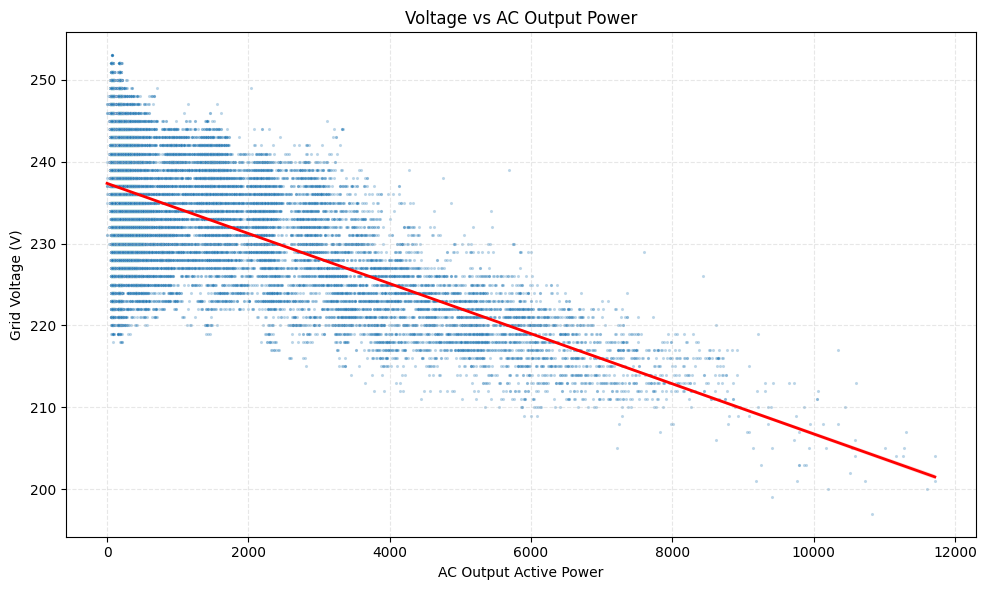
At near-zero local demand, grid voltage sits comfortably above 235V. At high demand approaching 10,000–12,000W - typical of a neighborhood after 6 PM when families return home and switch on ACs, refrigerators, and TVs simultaneously - voltage drops to the 200–205V range. For a network nominally rated at 230V, this is a significant and measurable departure from healthy operating conditions.
"Increased evening cooling demand was consistently associated with measurable voltage reduction across connected feeder segments."
If the scatter plot shows why voltage drops, the heatmap below shows when, and the pattern is striking. Across 37 days of data, low-voltage events concentrate almost exclusively in the post-6 PM window, peaking between 18:00–21:00.

Early in the observation period, the heatmap shows greens and yellows: broadly healthy voltage across all hours. By late April, red begins appearing in the evening columns. By May, those red cells deepen and spread - more dates, more hours, more stress. The observations indicate a repeatable daily load-driven voltage pattern.
This predictability is exactly what makes an intelligent response possible. The grid isn't failing randomly. It's following a repeating, behavioural pattern driven by millions of households switching on the same appliances at roughly the same time every evening after 6 PM.
India's smart meter rollout is important for utility-side operational modernization. But it's worth being precise about what smart meters are designed to do: billing, consumption tracking, remote disconnect, and utility-side accounting. They are not designed to function as a real-time, consumer-side power quality intelligence layer.
Which means even as smart meters proliferate, most consumers still have no visibility into when local voltage deteriorates, how frequently it happens, or whether their transformer is under stress every evening between 18:00 and 21:00.
A connected battery system like FlexiPOD continuously observes grid-side electrical behaviour - it has to, to manage charge cycles, protect the battery, and optimize energy flow. That monitoring capability, originally a means to an end, turns out to carry much larger value.
Every FlexiPOD deployment is now effectively a localized intelligence point for the distribution grid - not at the city level, not at the substation level, but at the transformer level, the feeder level, the neighborhood level.
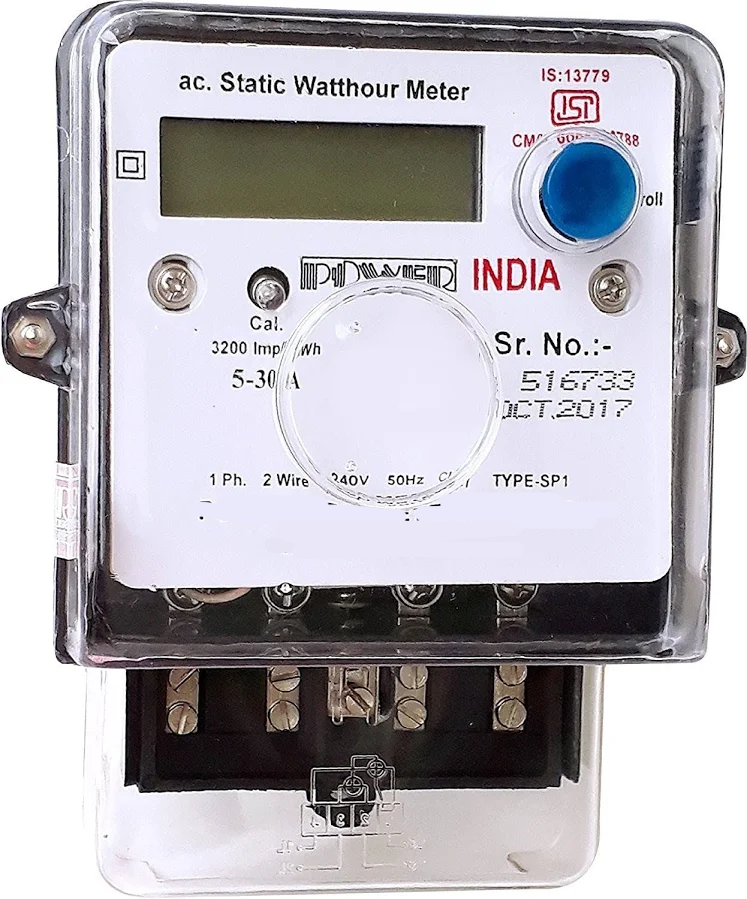
India has three conventional options for dealing with grid voltage problems: the smart meter rolling out at scale, the humble voltmeter, and the voltage stabiliser that millions of households already own. None of them were designed to do what distributed battery systems now do by default - continuously, automatically, and at neighborhood resolution.
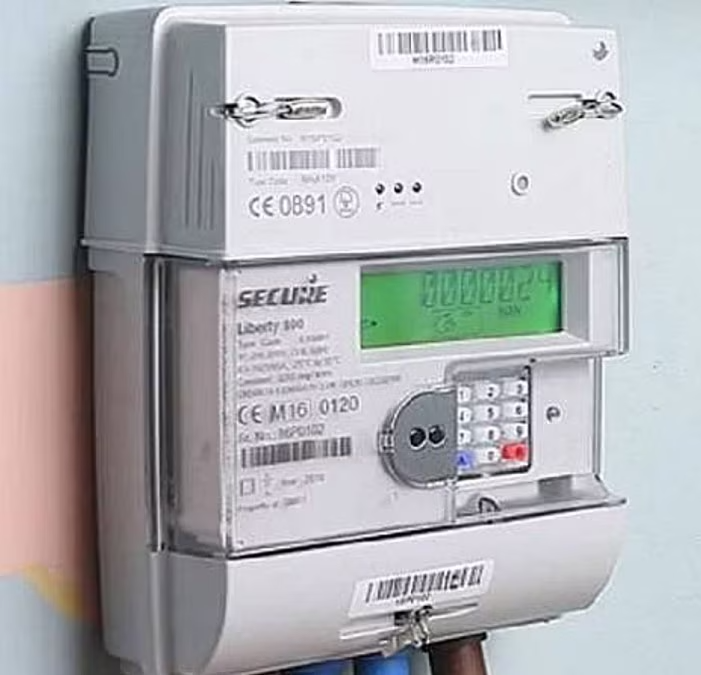
Designed for billing, remote disconnect, and consumption tracking. Reports to the utility - not to you.
Can show you voltage - but only when you're looking. Requires manual setup, monitoring, and interpretation.
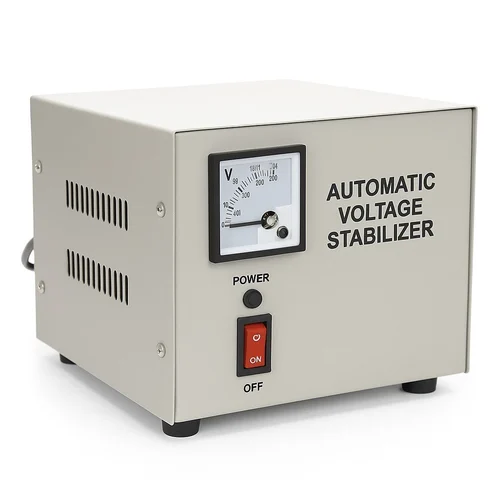
A widely-used household fix for low or fluctuating voltage — especially common for ACs and refrigerators in India. It compensates for sags by boosting output voltage, but operates blindly and protects only the one appliance it's wired to.

Continuously observes grid-side voltage as a byproduct of normal operation - no extra hardware, no manual monitoring.
| Capability | Smart meter | Voltmeter | Stabiliser | FlexiPOD |
|---|---|---|---|---|
| Real-time voltage visibility | ✕ | ~ manual | ✕ | ✓ |
| Continuous automatic logging | ✕ | ✕ | ✕ | ✓ |
| Voltage sag alerts | ✕ | ✕ | ✕ | ✓ |
| Pattern detection over weeks | ✕ | ✕ | ✕ | ✓ |
| Proactive load protection | ✕ | ✕ | ✕ | ✓ |
| No extra hardware needed | ✓ | ✕ | ✕ | ✓ |
| Consumer-side insight | ✕ | ~ if set up | ✕ | ✓ |
India is adding millions of distributed energy assets every year - lithium battery systems, rooftop solar, EV chargers, smart inverters, home energy systems. Most of them still operate blindly. But the grid in the future will not just store energy. It will understand the conditions around it.
Systems like FlexiPOD and FlexiTwin are early nodes in what could become a distributed intelligence layer for the Indian grid - built not through massive centralized infrastructure investment, but through thousands of connected energy assets continuously learning how electricity actually behaves at the neighborhood level, especially in the critical post-6 PM window.
Because the next challenge for India is not just generating more electricity. It's understanding what is happening to the grid before it shuts - and acting on that understanding before the consequences arrive.
FlexiPOD deployments are already revealing grid stress patterns that nobody else can see. Talk to TEC about what your energy data could tell you.
Learn about FlexiPOD ↗